2 to 3 Months
Online + Offline
15 Students Only Batch Size
Anyone
Beginner to Advanced Training


introduced to fundamental Excel formulas, including the versatile SUM formula for adding up numbers, AVERAGE for calculating the mean, MEAN for statistical averaging, MEDIAN for finding the middle value, SUMPRODUCT for multiplying and summing ranges, and CONCATENATE for combining text. Delve into Advanced Excel formulas crucial for data manipulation and analysis. Topics include VLOOKUP for vertical lookups, INDEX for retrieving values based on row and column numbers, MATCH for locating a value in a range, IF for conditional statements, COUNTIF for counting cells that meet specific criteria, and SUMIF for conditional summation. Learn essential data management skills, such as removing duplicate entries from datasets to ensure data integrity. Explore the power of conditional formatting to visually highlight and organize data based on specified conditions. Gain proficiency in creating visually appealing and insightful charts in Excel. Participants will learn to use various chart types to represent data effectively, aiding in data interpretation and communication. Understand the importance of data organization through sorting and filtering techniques. Explore Advanced data filtering options and delve into the benefits of converting data into Excel tables for improved data manipulation and analysis. Participants will explore Advanced Excel features to enhance formula usage. This section covers nested functions, efficient use of IF statements, and employing array formulas for complex calculations. Focus on Advanced lookup functions, including the powerful INDEX and MATCH combination for more flexible and dynamic searches. Explore complex scenarios using VLOOKUP for precise data retrieval. Learn text manipulation functions such as CONCATENATE, LEFT, RIGHT, MID, and explore techniques for separating and manipulating text strings in Excel. Master the art of working with Pivot Tables to dynamically analyze and summarize data. Participants will also learn to create Pivot Charts that visually represent data trends and patterns effectively.
Arithmetic: Addition and Subtraction: Basic operations of addition and subtraction. Solving simple arithmetic problems. Multiplication and Division: Multiplying and dividing numbers. Problem-solving with multiplication and division. Weighted Average: Definition: Understanding the concept of weighted average. Calculating weighted averages. Applications: Real-world applications. Examples of weighted average. Cumulative Sum: Basics: Definition and calculation. Sequential summation of data. Applications: Practical use cases. Analyzing trends through cumulative sum. Percentile: Definition: Understanding percentiles. Calculating percentiles. Interpretation: Interpreting percentile values. Use in data analysis. Basic Statistics Mean: Arithmetic Mean: Computing mean for a set. Role in data representation. Weighted Mean: Calculations with weighted datasets. Applications of weighted mean. Median: Calculation: Identifying median. Finding the median value. Handling Skewed Distributions: Using median in skewed distributions. Mean vs. median in different scenarios. Mode: Definition: Defining mode statistically. Identifying modes in datasets. Multimodal Distributions: Handling datasets with multiple modes. Significance of multimodal distributions. Standard Deviation: Definition: Understanding standard deviation. Calculation for a dataset. Interpretation: Interpreting standard deviation. Implications for data variability. Normal Distribution: Characteristics: Identifying normal distribution properties. Understanding the bell-shaped curve. Z-Score and Normalization: Introducing Z-score for standardization. Normalizing data with the standard normal distribution.
SELECT Statement: Retrieving data: SELECT column1, column2 FROM table; WHERE Clause: Filtering data: SELECT column1 FROM table WHERE condition; DISTINCT Keyword: Returning unique values: SELECT DISTINCT column FROM table; LIKE Operator: Pattern matching: SELECT column FROM table WHERE column LIKE pattern; BETWEEN Operator: Selecting within a range: SELECT column FROM table WHERE column BETWEEN value1 AND value2; ORDER BY Clause: Sorting results: SELECT column FROM table ORDER BY column ASC/DESC; LIMIT Keyword: Restricting rows: SELECT column FROM table LIMIT number; GROUP BY Clause: Grouping rows: SELECT column1, COUNT(column2) FROM table GROUP BY column1; HAVING Clause: Filtering grouped results: SELECT column1, COUNT(column2) FROM table GROUP BY column1 HAVING condition; INSERT Statement: Adding records: INSERT INTO table (column1, column2) VALUES (value1, value2); UPDATE Statement: Modifying records: UPDATE table SET column1 = value1 WHERE condition; ALTER Statement: Modifying table: ALTER TABLE table ADD COLUMN column_name datatype; IMPORT Statement: Loading data: IMPORT DATA INTO TABLE table FROM 'file_path'; Data Types: Defining column types: INTEGER, VARCHAR, DATE, BOOLEAN, etc.
Variables: Storing data values for later use. Data Types: Defining the type of data stored. Lists: Ordered, mutable collections of elements. Tuples: Ordered, immutable collections. Dictionaries: Unordered key-value pairs. Sets: Unordered, unique elements. Conditional Statements and Loops: Conditional Expressions: Making decisions based on conditions. If Statements: Executing code based on a condition. Loops: Repeating code execution. For Loops While Loops Functions and Modules: Functions: Reusable blocks of code. Modules: Organizing code into separate files. Operators: Performing operations on variables. Object-Oriented Programming (OOP): Classes and Objects: Creating reusable, structured code. Python Libraries: Pandas: Read/Write Operations: Reading and writing CSV, Excel, and JSON files. DataFrames: Working with structured data. Data Manipulation and Analysis: Group by, Concatenate, Merge operations. Matplotlib: Creating Visualizations: Static, animated, and interactive plots.

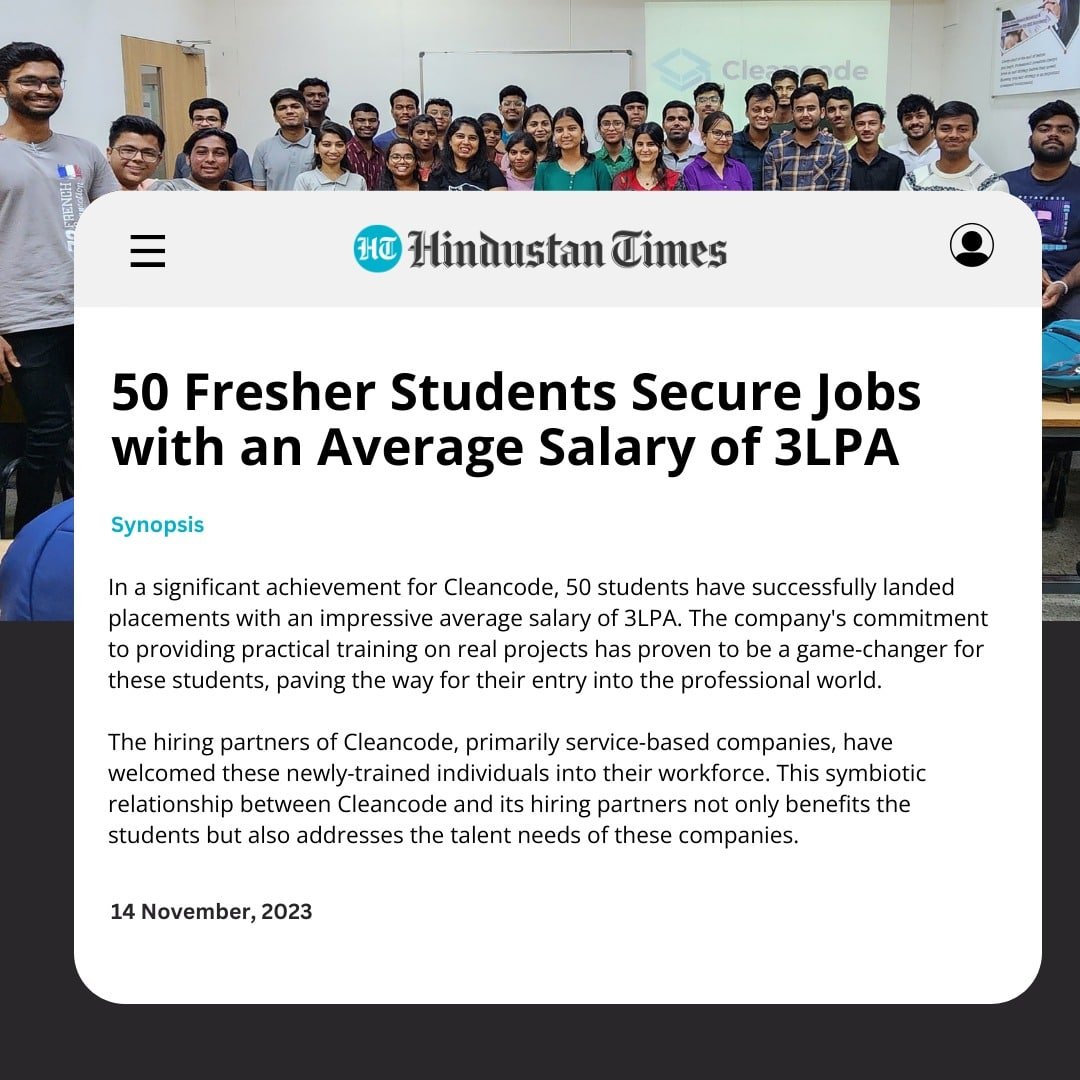
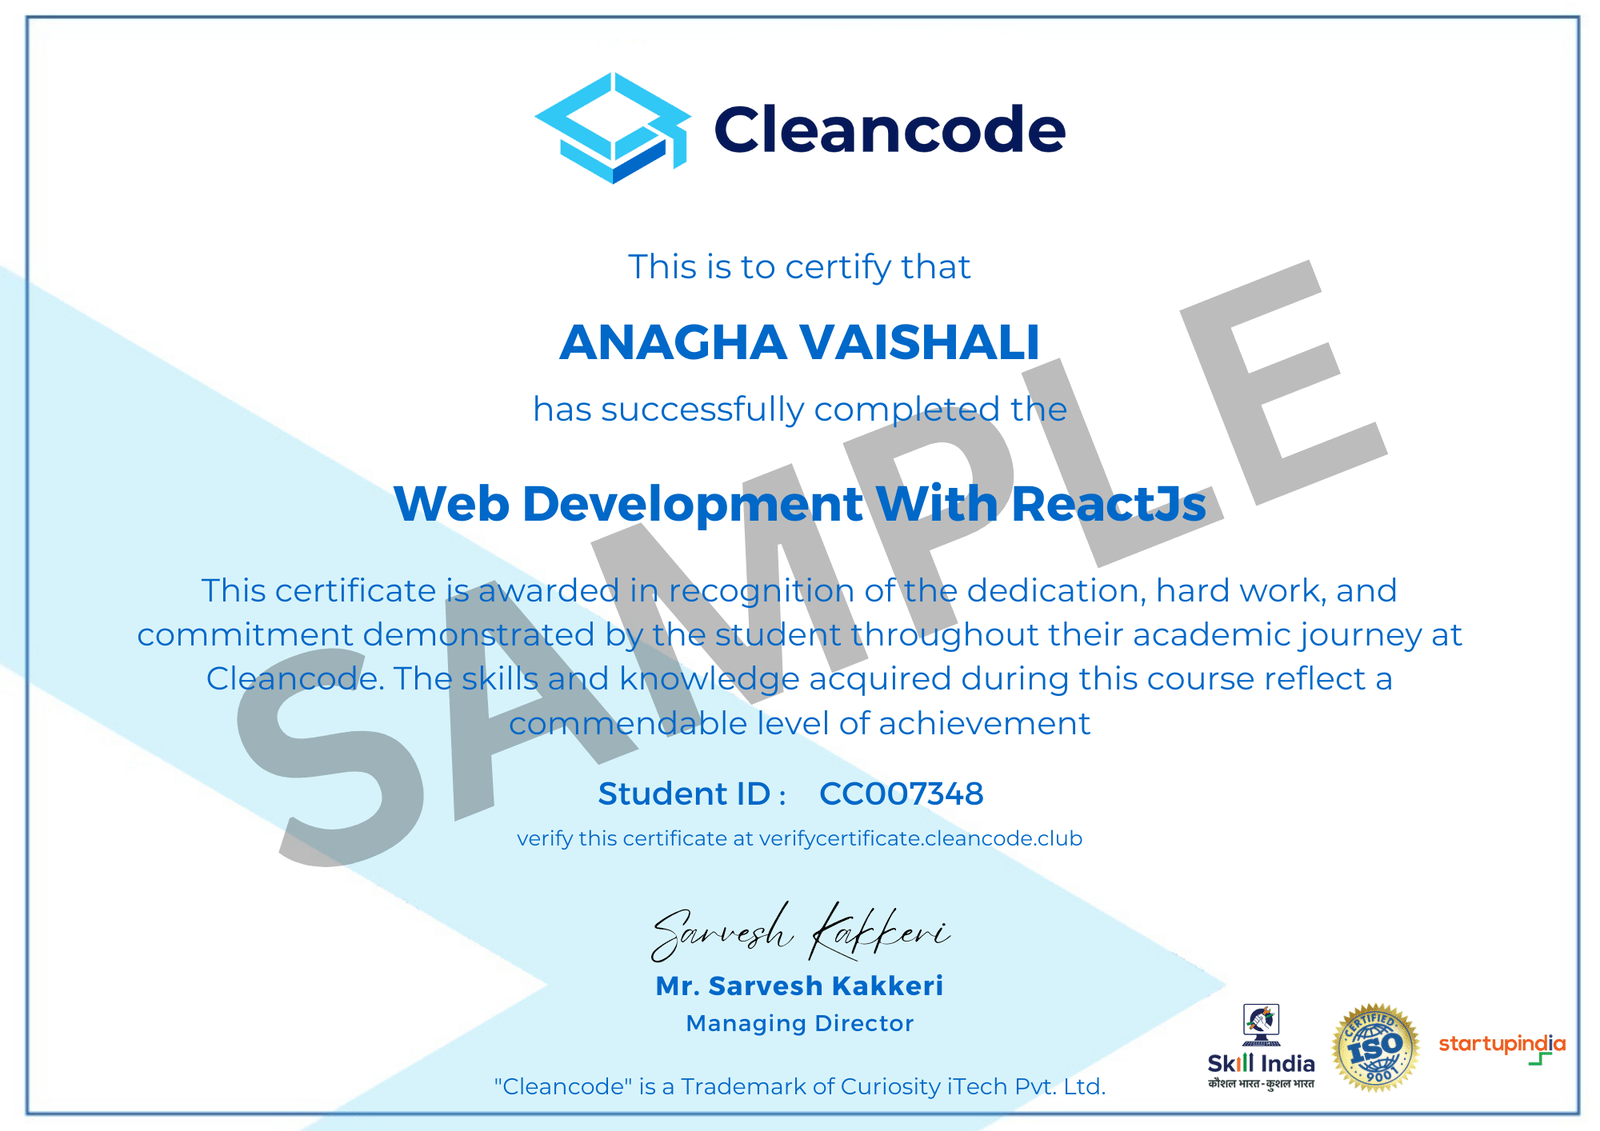
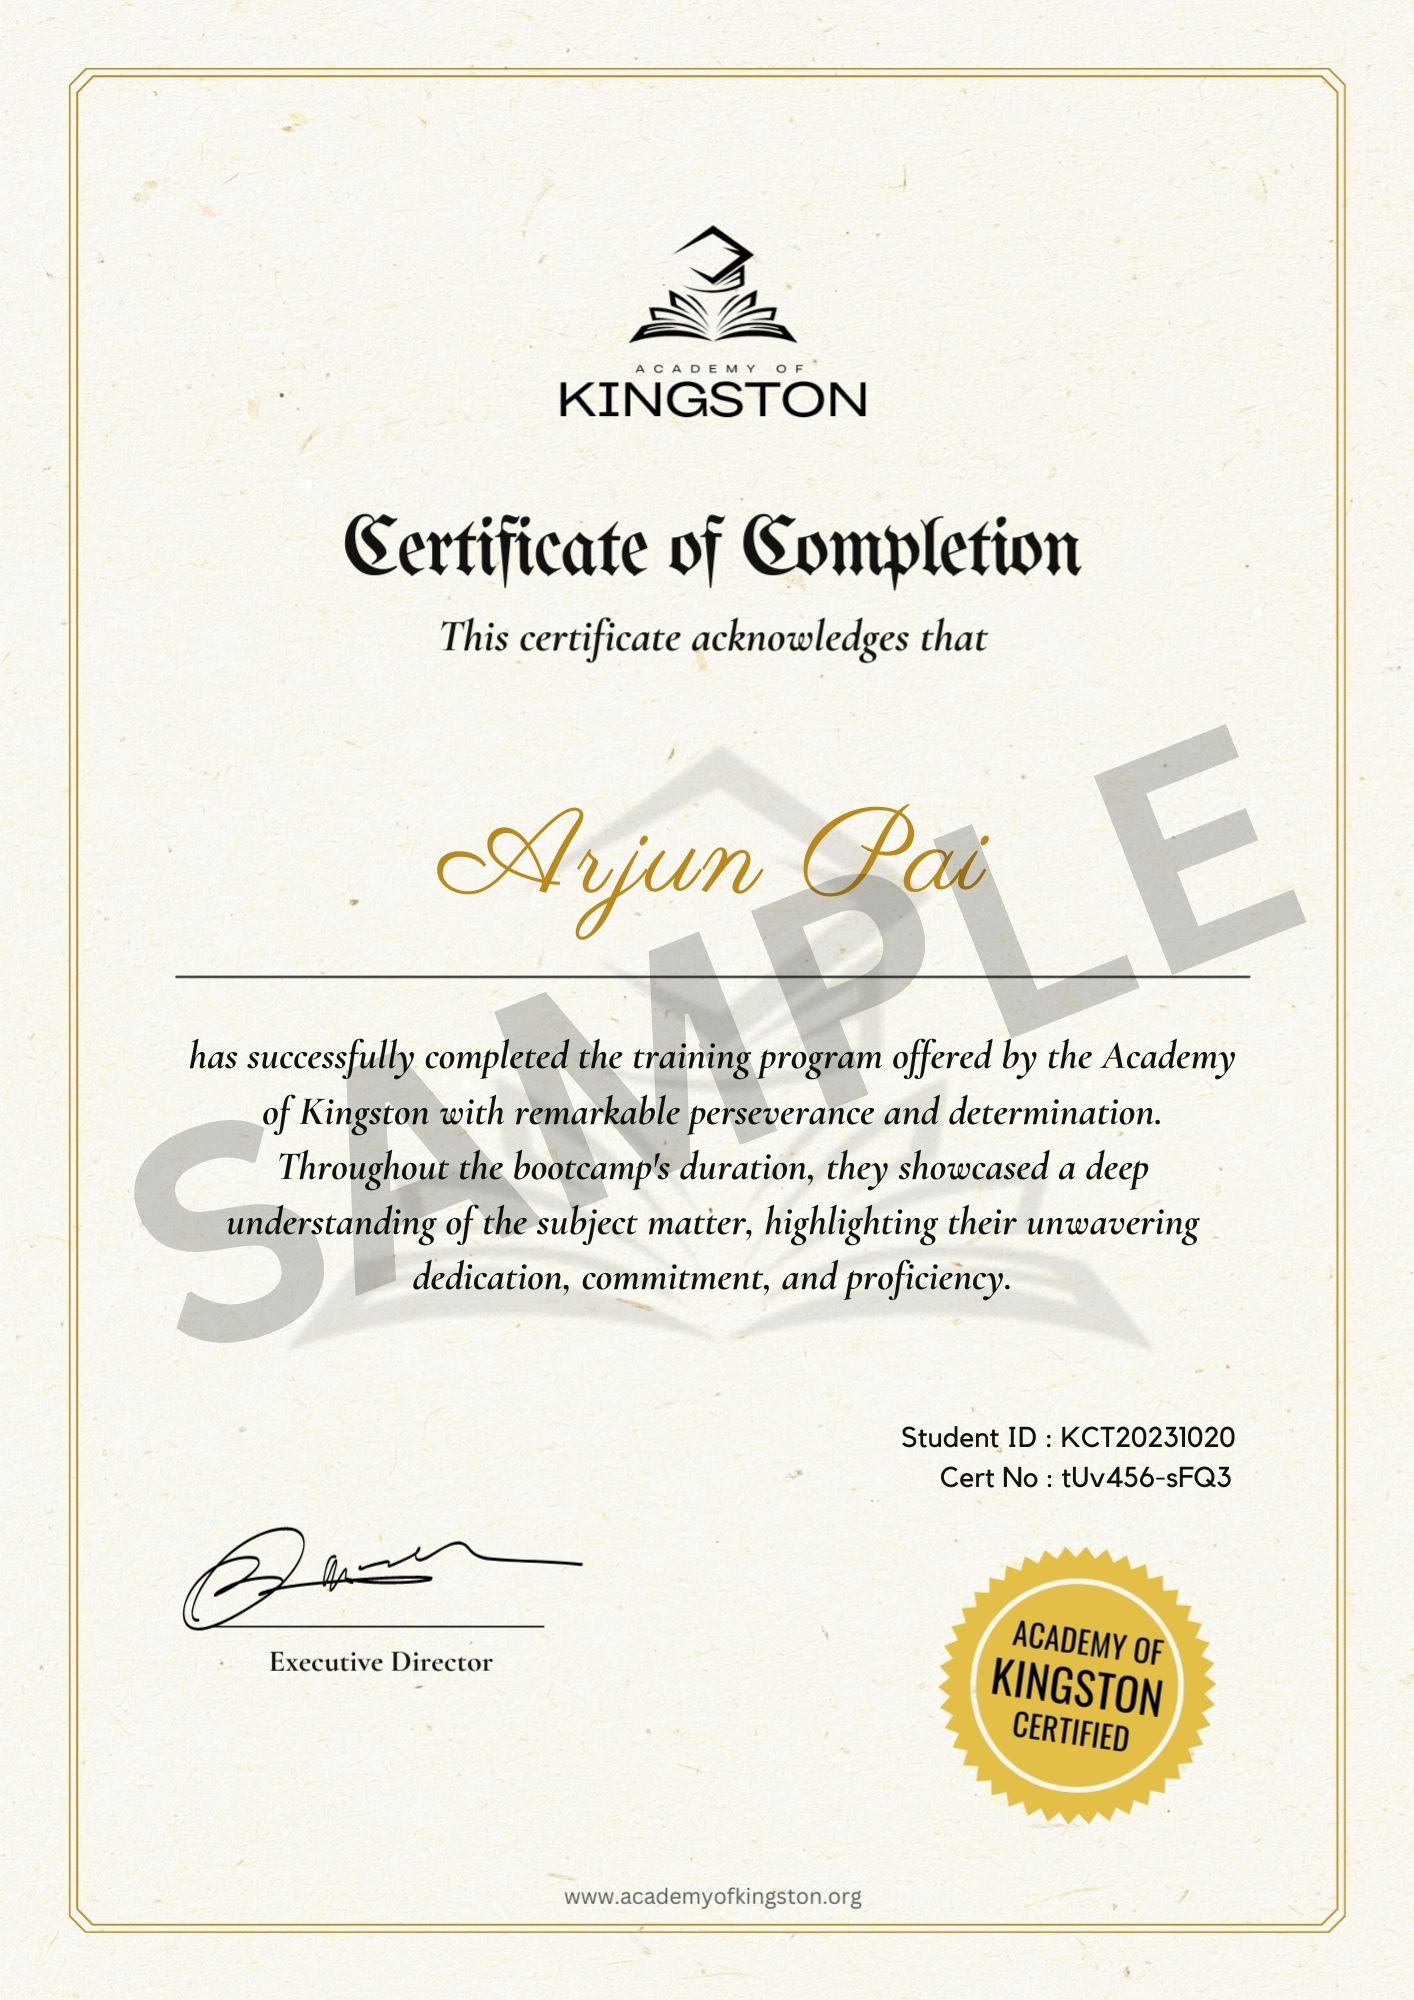
Once you have completed the course, assignments, exercise and submit the projects you will be able to generate the certificate.
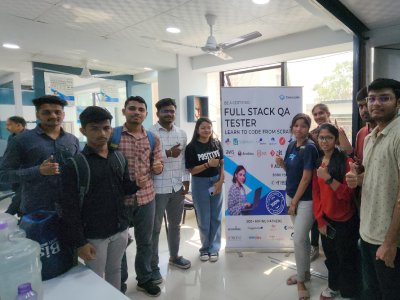
Our Students and curriculum have been trusted by over 500+ companies across India